The predicted value of the longitudinal strain d33 coefficient is -0.62 pC/N. Note: The longitudinal component d33 can be experimently measured using a piezometer with a quasi-static force applied to the (001) plane along the crystallographic c-axis of single crystals (Guerin et al., 2017).
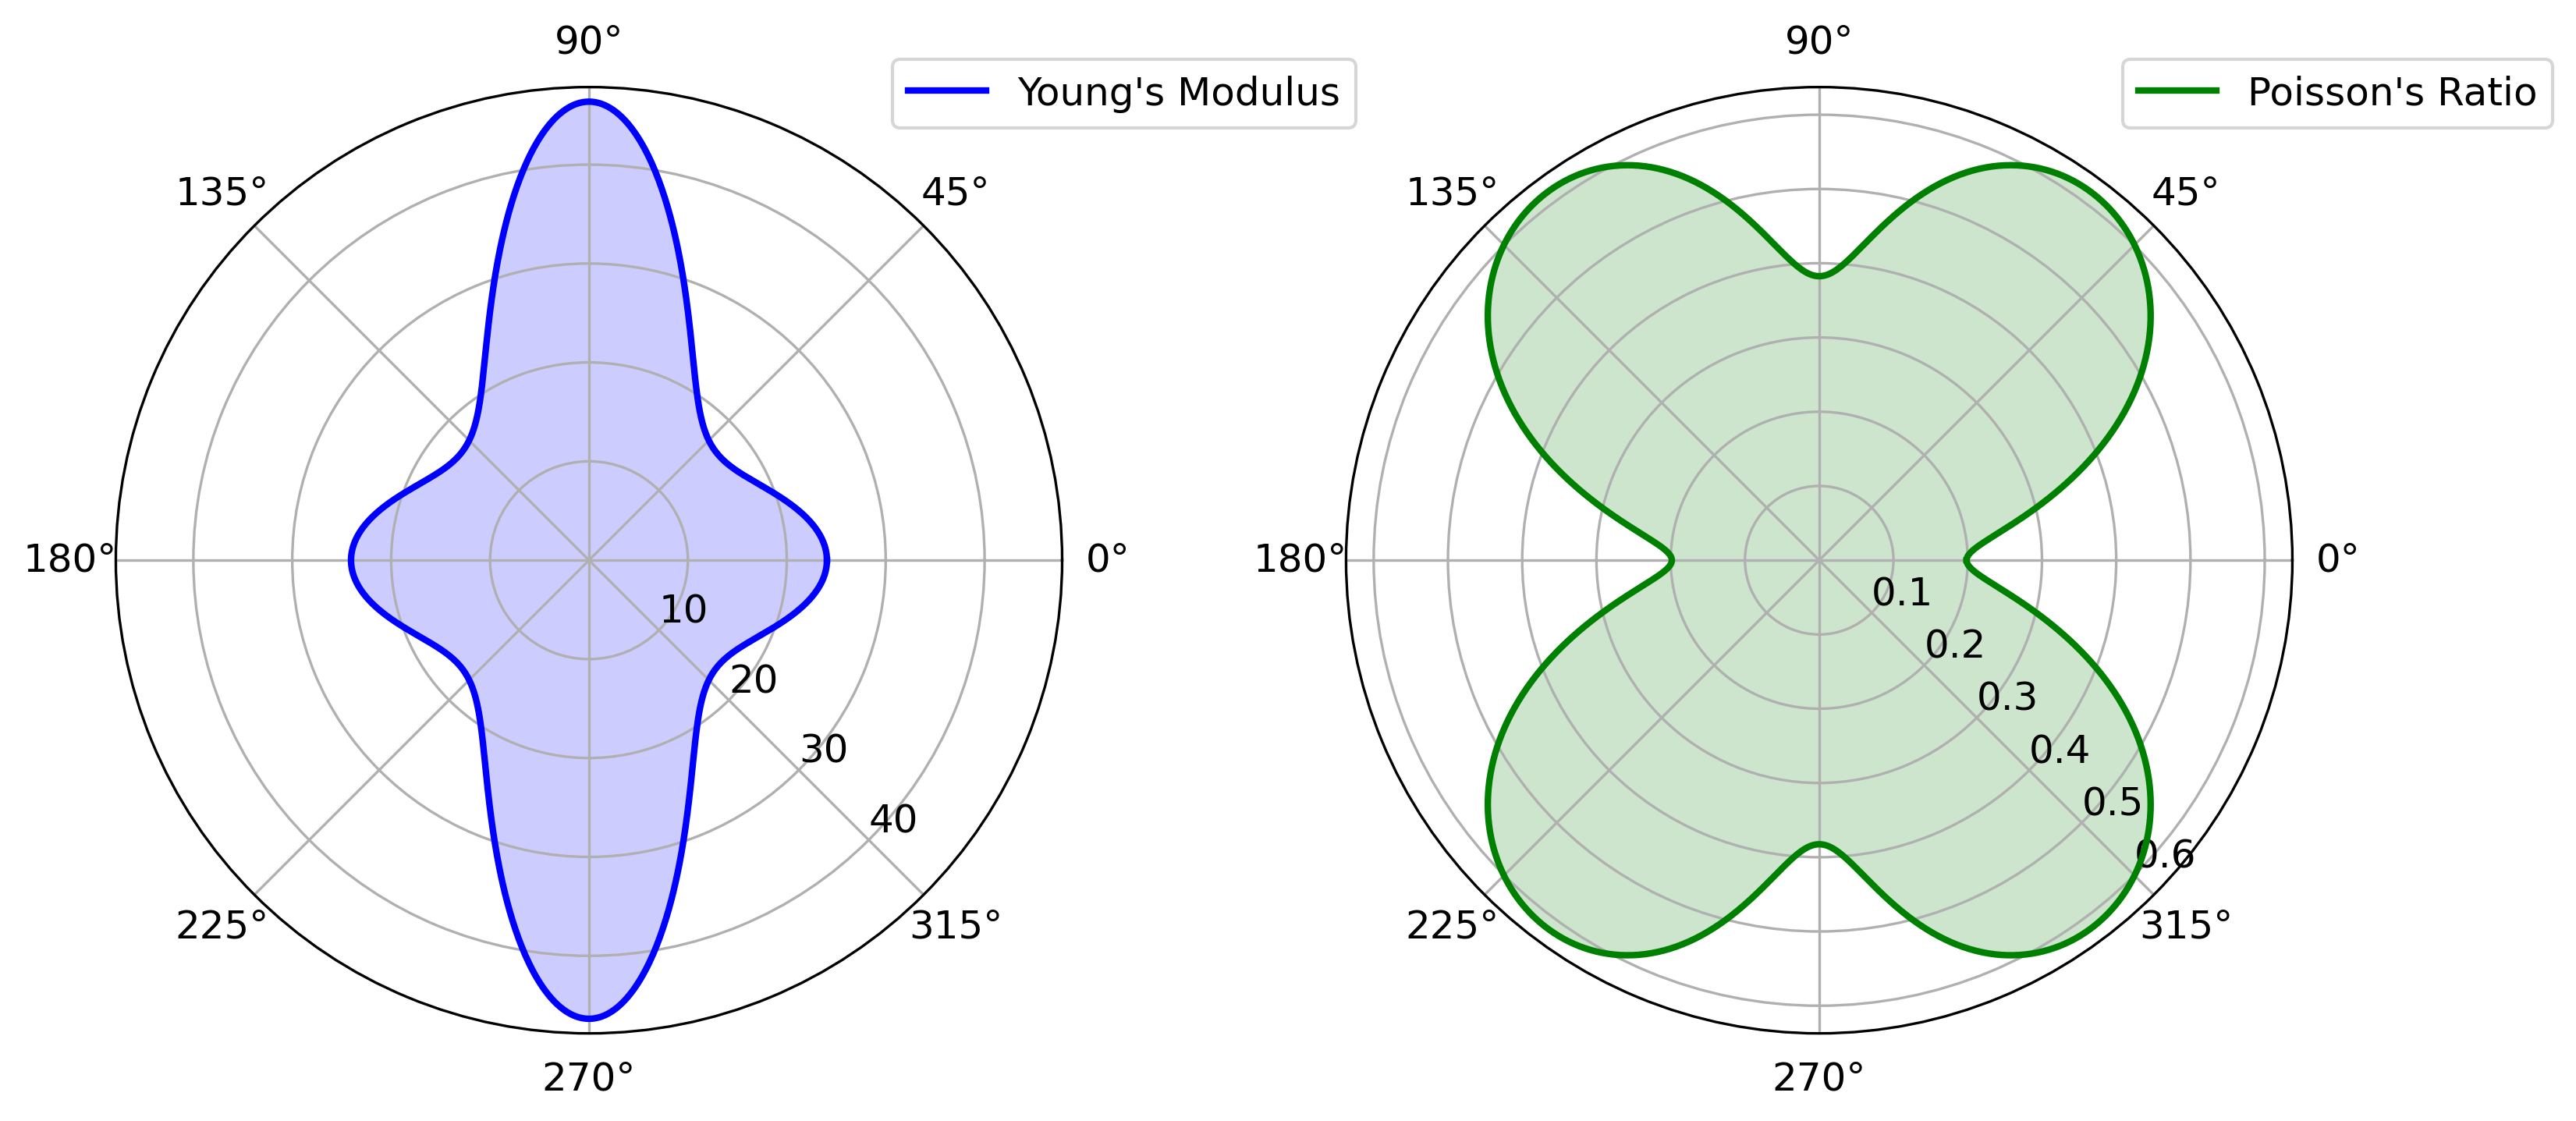
2D Plots of the Elastic Tensor (C):
Figure: 2D Plots of the Elastic Tensor (C): Directional Dependence of Young's Modulus (GPa) and Poisson's Ratio. First-principles calculations are performed to systematically investigate the electronic structures, elastic properties, and their anisotropic nature.HD View
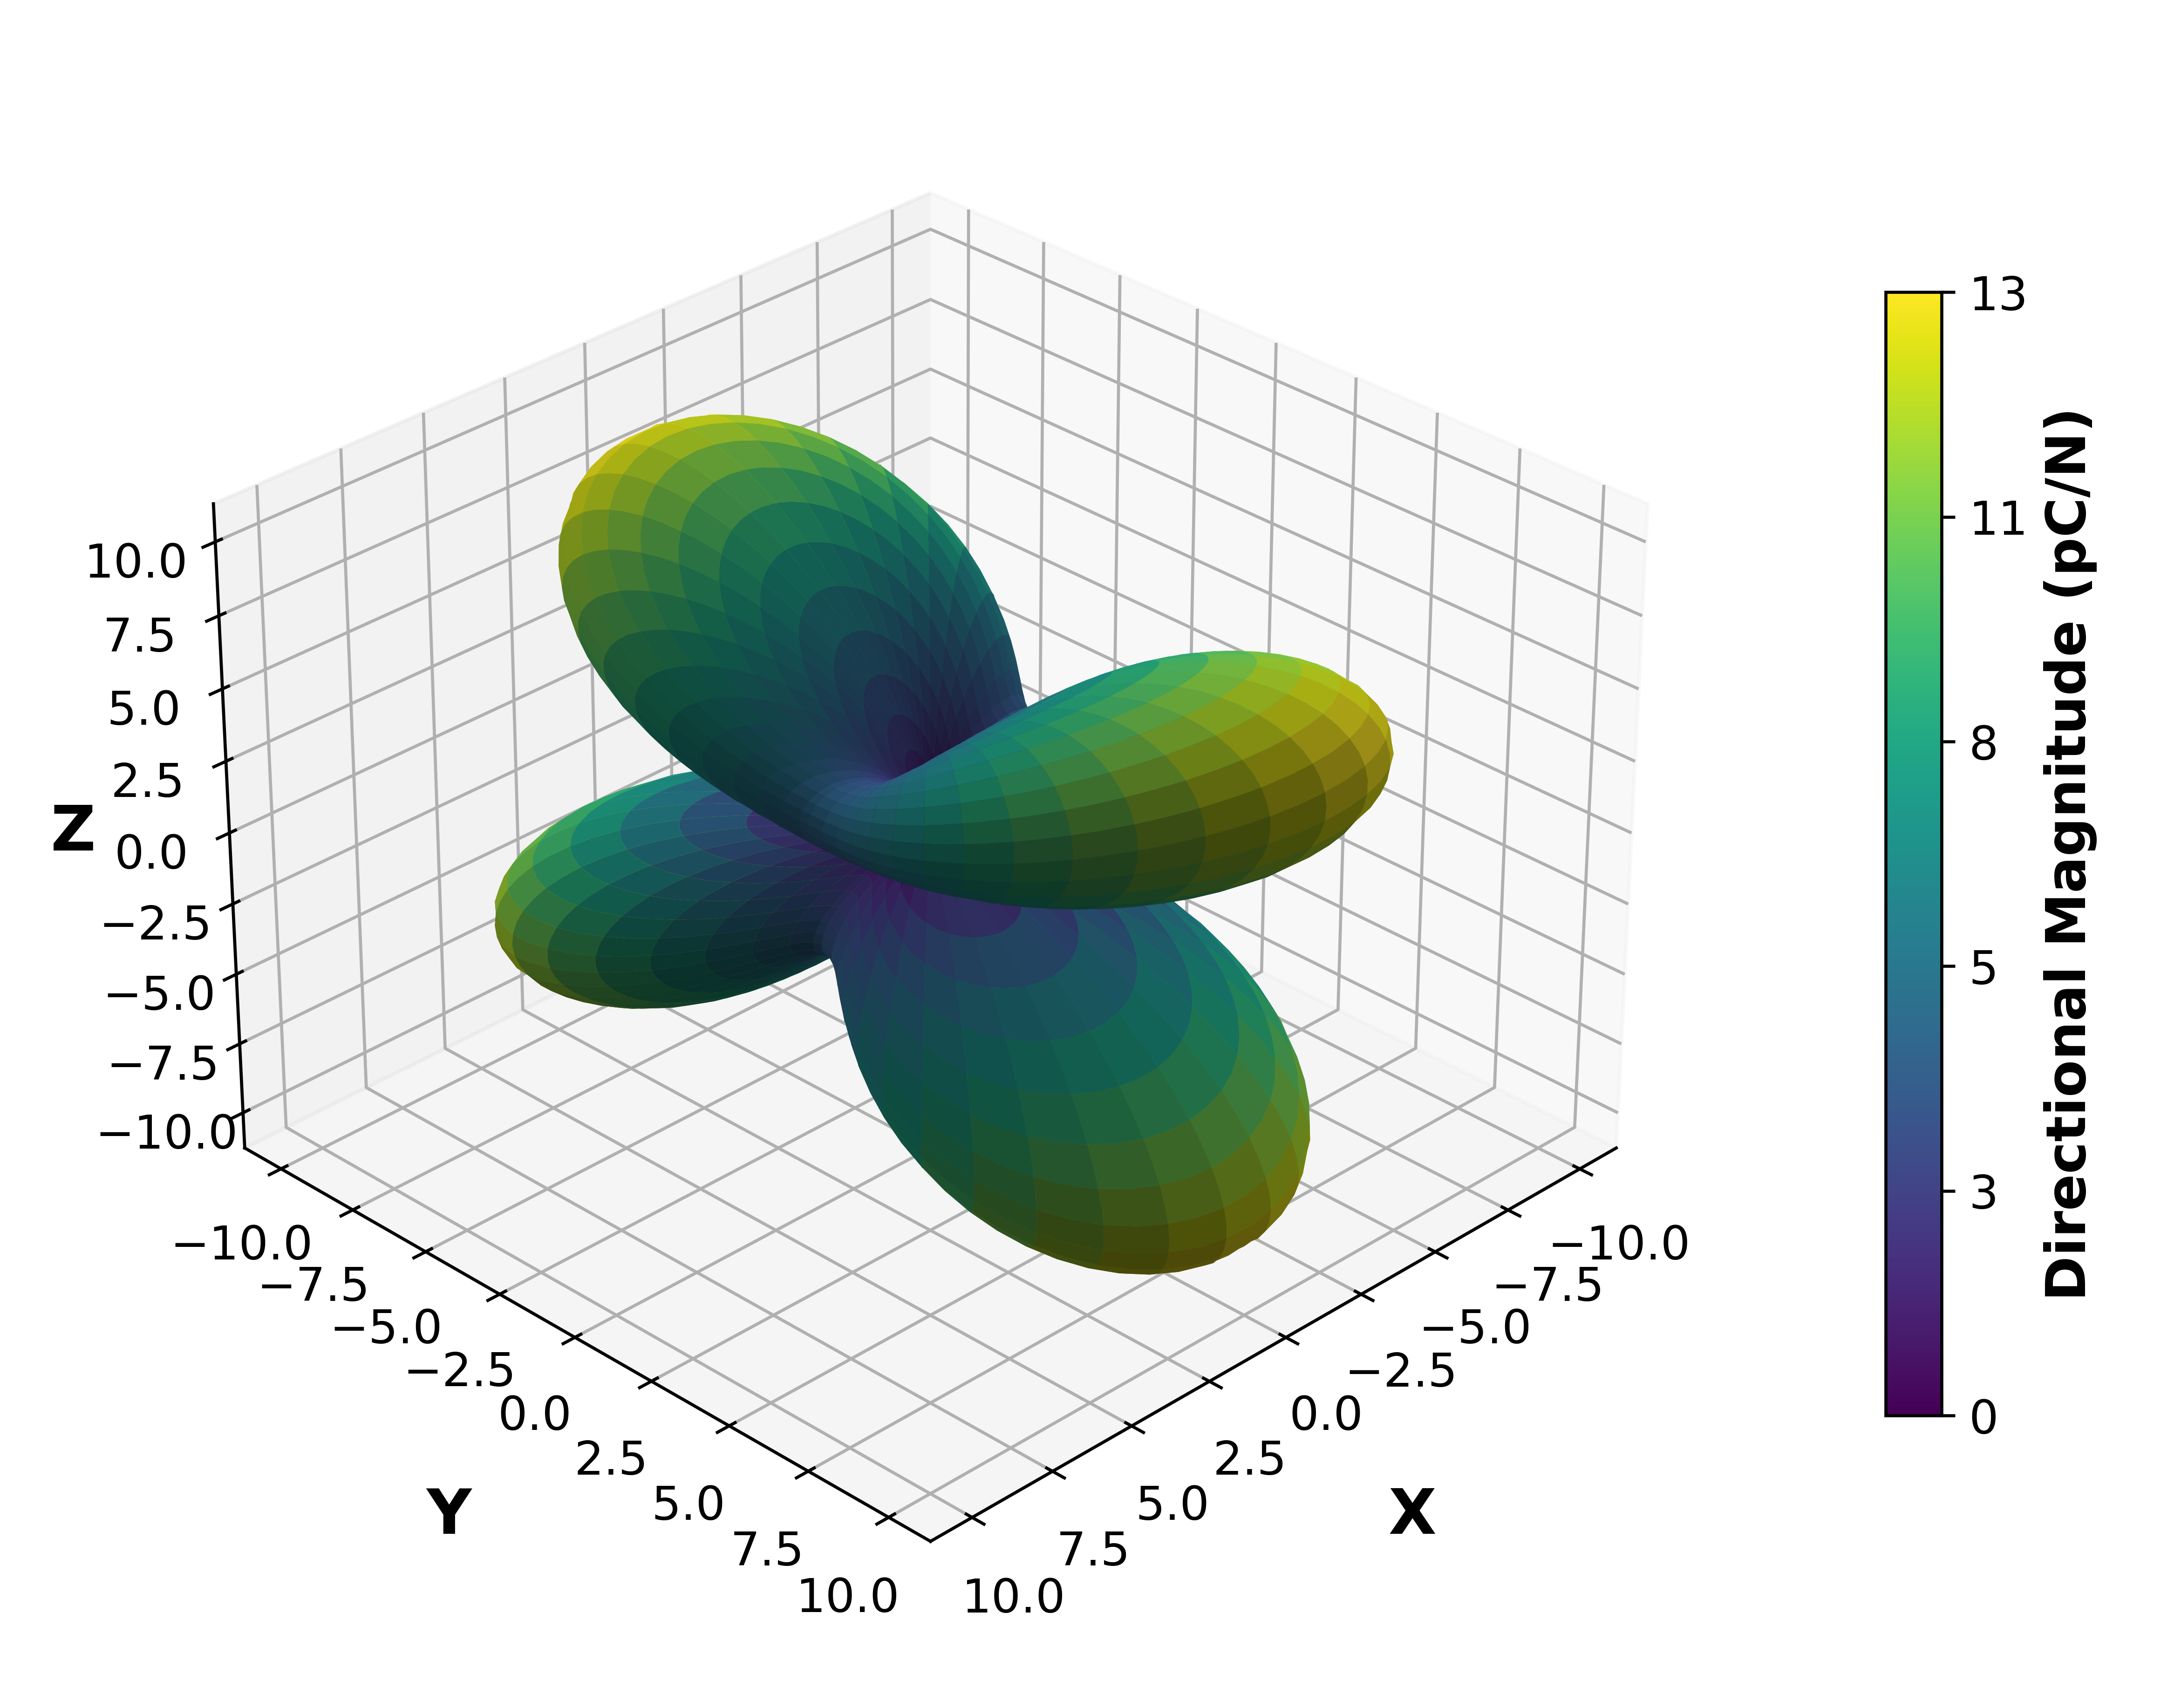
3D Plot of the Piezoelectric Tensor (d):
Figure: 3D surface representation of the piezoelectric strain tensor (dij) for the crystal. The surface magnitude illustrates the directional dependence of the piezoelectric response in units of pC/N, revealing anisotropic behaviour linked to the crystal symmetry and atomic arrangement. The plot visualises how mechanical deformation induces electric polarisation along different crystallographic directions.HD View